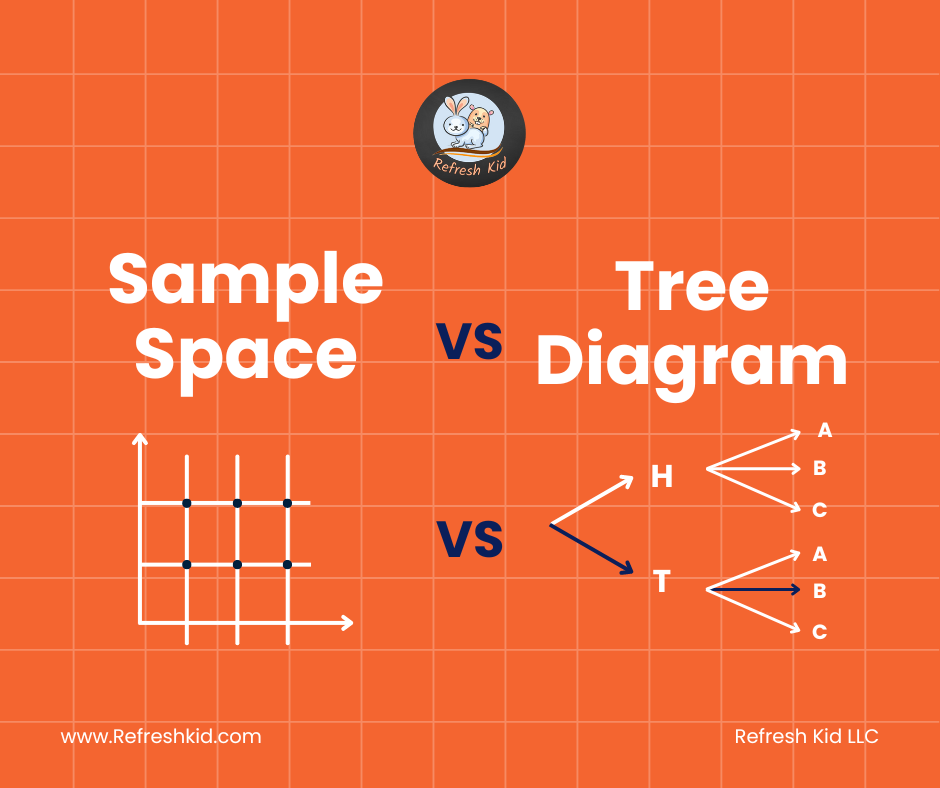
Comprehensive Guide to Sample Space: Detailed Numerical Examples Using Lists, Tables, & Tree Diagrams:
Introduction:
Understanding the sample space is crucial in probability theory, as it outlines all potential outcomes of an experiment. This detailed guide provides various numerical examples to illustrate how sample spaces can be represented and utilized in probability calculations.
What is a Sample Space?
The sample space (denoted as SS) comprises all conceivable outcomes of a probabilistic experiment. Its complexity can vary based on the experiment's design.
Representations of Sample Spaces with Numerical Examples:
1. List Representation:
Lists provide a straightforward way to display all potential outcomes, especially when they are limited and distinct.
Numerical Example: Imagine rolling a 4-sided die (with faces numbered from 1 to 4). The sample space can be listed as:
- S = {1, 2, 3, 4}
Another example is drawing a card from a set consisting of a King, Queen, and Jack:
- S = {King, Queen, Jack}
2. Table Representation:
Tables help organize sample spaces in a structured format, making them ideal for complex experiments or multiple random variables.
Numerical Example: Suppose you have a bag with 3 red balls and 2 blue balls, and you draw two balls sequentially without replacement. The sample space can be visualized in a table:
-
Draw 1 Draw 2 (if Red) Draw 2 (if Blue) Red Red, Red Red, Blue Blue Blue, Red Blue, Blue
Another Example: Rolling two different-colored dice, one red and one green, each six-sided:
-
Red Die Green Die 1 1 1 2 ... ... 6 6
This table shows all 36 possible outcomes, highlighting the combinations of results from both dice.
3. Tree Diagram:
Tree diagrams are excellent for illustrating sequences of events and dependencies among outcomes.
Numerical Example: Consider a game where you toss a coin and then roll a die if the coin comes up heads. If tails, you draw a card from a deck that contains only an Ace and a King. The tree diagram illustrates these possible outcomes:
- Coin Toss: Heads, Tails
- If Heads: Roll Die (1 to 6)
- If Tails: Draw Card (Ace, King)
Another Example: Drawing three cards from a deck, replacing each card after drawing:
- First draw: Ace, King, Queen
- Second draw (following Ace): Ace, King, Queen
- Third draw (following Ace then King): Ace, King, Queen
- Second draw (following Ace): Ace, King, Queen
Choosing the Right Representation:
The method of representation is chosen based on the complexity of the experiment and the clarity required. While lists are simplest, tables provide clear visual organization, and tree diagrams offer detailed insights into sequential probabilities.
Conclusion:
Accurate representation of sample spaces is essential for effective probability analysis. This guide, enriched with practical numerical examples, provides a solid foundation for understanding and applying different methods of representing sample spaces in various probabilistic scenarios.


